Knowledge & reporting
Nayancode Lab Studio
qPCR, dose–response and power calculations, checked against R.
Bench calculators: qPCR ΔΔCt and Pfaffl, 4PL / 5PL dose–response with IC50, and power and sample size, with publication-ready figures.
Free · runs in your browser · nothing uploaded
Overview
What Lab Studio does
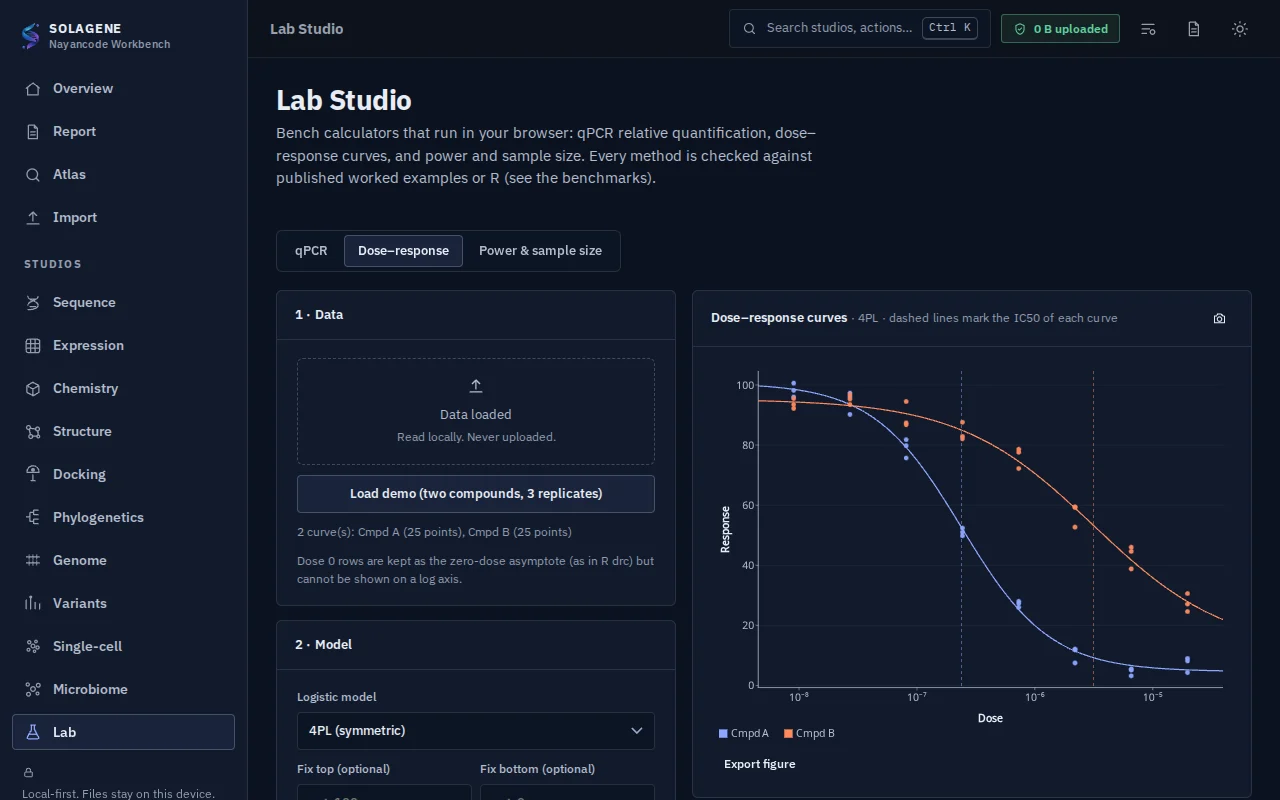
Lab Studio covers the calculations a wet lab does every week. qPCR relative quantification by ΔΔCt (Livak) or efficiency-corrected Pfaffl with several reference genes, geNorm stability, replicate outlier flags and statistics on ΔCt; standard-curve efficiency; 4PL and 5PL dose–response fits with IC50 confidence intervals; and power and sample size for t tests, ANOVA, proportions, survival and RNA-seq.
Every method is validated against the original papers and R packages (drc, pwr, RNASeqPower, gsDesign, NormqPCR), and every chart exports to SVG, PDF or 300 / 600 dpi PNG.
Technical specifications
- Inputs
- Plate CSV (long or wide) · Dose–response CSV · Standard-curve CSV
- Outputs
- Fold-change tables · IC50 and curve parameters · Sample-size tables · Figures (SVG, PDF, PNG)
- Engine
- TypeScript (Levenberg–Marquardt, non-central t/F)
- Platforms
- Chrome, Edge, Firefox and Safari (current versions) · Windows, macOS, Linux and ChromeOS · No installation, no account, no upload
- Limits
- Equal-sized groups in the power tools; dose–response assumes independent replicates and constant variance
- Licence
- Free during the public preview; institutional licences on request
Features
Capabilities
qPCR ΔΔCt and Pfaffl
Multiple reference genes, geNorm, technical-replicate outliers, t-test or ANOVA on ΔCt.
Standard curves
Amplification efficiency and R² from a dilution series.
Dose–response
4PL and 5PL fits with IC50, Hill slope and 95 % confidence intervals.
Power and sample size
t tests, ANOVA, proportions, log-rank and RNA-seq designs.
Publication figures
SVG, PDF and 300 / 600 dpi PNG with colour-blind-safe palettes.
Use cases
Who uses it, and for what
- Analysing a qPCR plate export
- Reporting IC50 values with confidence intervals
- Planning group sizes for a grant or ethics application
Documentation
Quick start
Open Lab Studio
Use the button on this page or the Workbench menu. Nothing to install; works in current Chrome, Edge, Firefox and Safari.
Load data or the demo
Drop in your files (Plate CSV (long or wide), Dose–response CSV, Standard-curve CSV) or load the labelled synthetic demo to explore safely.
Run and inspect
Results appear as interactive figures and tables; each analysis records its parameters and versions.
Export and cite
Export figures and tables, add them to a report, and copy the auto-written methods paragraph.
Learn the methods with Vedicgen
Courses that use Lab Studio
Talk to us
Request a demo or ask a question
For classroom use, self-hosted deployments, custom studios or support. We reply within two working days.
Public preview: Free
Academic & teaching: Free for classrooms
Institutional & enterprise: On request